Visual Analytics in Industrial Environments: From Data to Decision-Making
Industrial systems generate complex data from multiple sources, including machines, sensors, and operational platforms. While this data holds valuable insights, it can be difficult to interpret without proper visualization tools.
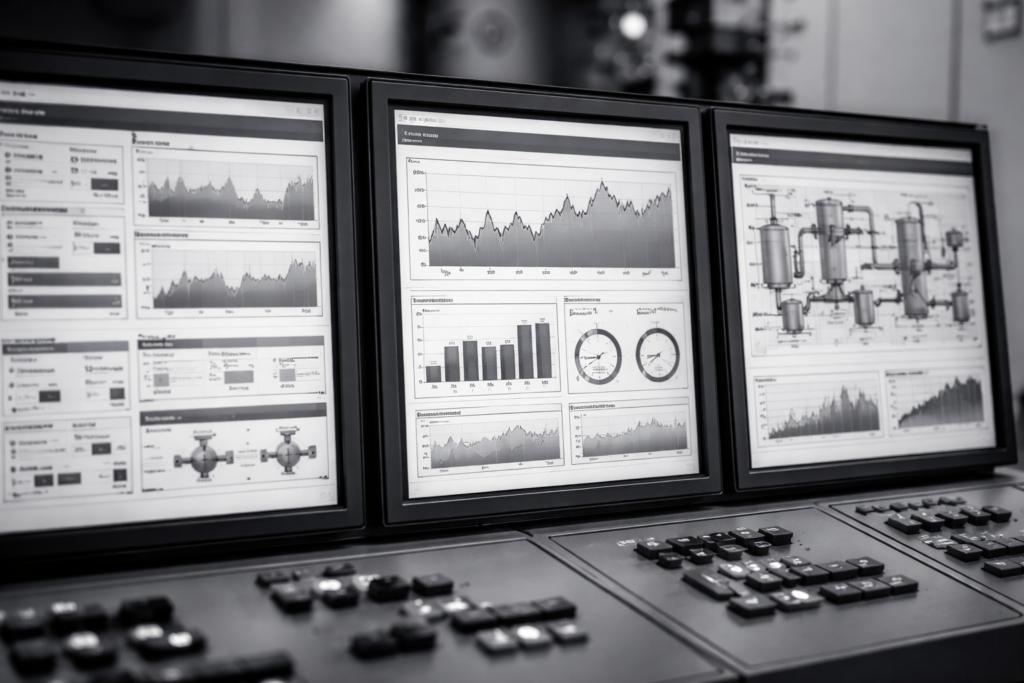
Visual analytics enables organizations to transform complex data into clear, structured, and accessible insights. By presenting data through dashboards and visual interfaces, teams can better understand performance and make informed decisions.
What Is Visual Analytics?
Visual analytics is the process of representing data through visual formats such as dashboards, charts, and graphs. It allows users to quickly interpret large datasets and identify trends, patterns, and anomalies.
Supported by data engineering platforms, visual analytics relies on structured and accurate data to deliver meaningful insights.
- Data visualization through dashboards
- Clear representation of key performance indicators
- Identification of trends and patterns
- Improved understanding of complex data
Enhancing Data Visibility Across Operations
Visual analytics improves visibility by consolidating data from multiple systems into a single interface. This allows organizations to monitor operations in real time and gain a comprehensive view of performance.
Through integration with IoT solutions, data from connected systems can be visualized and analyzed continuously.
- Centralized dashboards for operational monitoring
- Real-time performance tracking
- Improved situational awareness
- Enhanced coordination across teams
Supporting Faster and Better Decision-Making
One of the key benefits of visual analytics is its ability to support faster and more effective decision-making. By presenting data in a clear and intuitive format, teams can quickly identify issues and take appropriate action.
Integrated with Industrial Data & AI Intelligence, visual analytics helps organizations move toward more data-driven operations.
- Quick identification of operational issues
- Improved decision accuracy
- Faster response times
- Better resource management
Detecting Trends and Anomalies
Visual analytics makes it easier to detect trends and anomalies in data. By analyzing visual representations, organizations can identify patterns that may not be visible through raw data alone.
Supported by data science and analytics, visual analytics enables deeper insights into operational performance.
- Identification of performance trends
- Early detection of anomalies
- Improved forecasting capabilities
- Enhanced operational insights
Integration with AI and Advanced Analytics
When combined with AI, visual analytics becomes even more powerful. AI-driven systems can analyze data and present insights through visual dashboards, enabling users to understand complex information more easily.
Leveraging AI-driven solutions, organizations can enhance their analytical capabilities and improve operational intelligence.
- AI-enhanced data visualization
- Automated insight generation
- Improved analytical accuracy
- Continuous performance optimization
Conclusion
Visual analytics is a critical component of modern industrial operations. By transforming complex data into clear and actionable insights, it enables organizations to improve decision-making and optimize performance.
As industrial systems continue to evolve, visual analytics will play an increasingly important role in supporting data-driven strategies and operational excellence.
Disclaimer: This article is provided for informational purposes only. It describes visual analytics concepts and operational approaches without representing performance guarantees or specific system outcomes.
FAQ
What is visual analytics in industrial environments?
Visual analytics is the process of presenting industrial data through dashboards, charts, and graphs to help teams understand performance and make informed decisions.
How does visual analytics improve decision-making?
By displaying data in a clear and structured format, visual analytics allows teams to quickly identify issues, trends, and opportunities, enabling faster and more accurate decisions.
What types of data are used in visual analytics?
Visual analytics uses data from machines, sensors, operational systems, and environmental monitoring platforms.
How does visual analytics support real-time monitoring?
Visual analytics displays live data through dashboards, allowing organizations to monitor operations continuously and respond immediately to changes.
Can visual analytics detect anomalies in operations?
Yes, visual analytics helps identify unusual patterns or deviations in data, allowing teams to detect issues early and take corrective action.
How does visual analytics integrate with IoT systems?
Visual analytics platforms connect with IoT systems to display real-time data collected from sensors and devices in a centralized dashboard.
What is the role of data science in visual analytics?
Data science processes and analyzes raw data, while visual analytics presents those insights in a clear and understandable format.
Which industries benefit from visual analytics?
Industries such as manufacturing, energy, logistics, and facility management benefit from visual analytics by improving visibility and operational performance.